Convention Surges Reshaping Room Availability and Pricing Strategies Near Major Exhibition Halls
Written by Tina Vogel · Jul 9, 2026
Convention Surges Reshaping Room Availability and Pricing Strategies Near Major Exhibition Halls
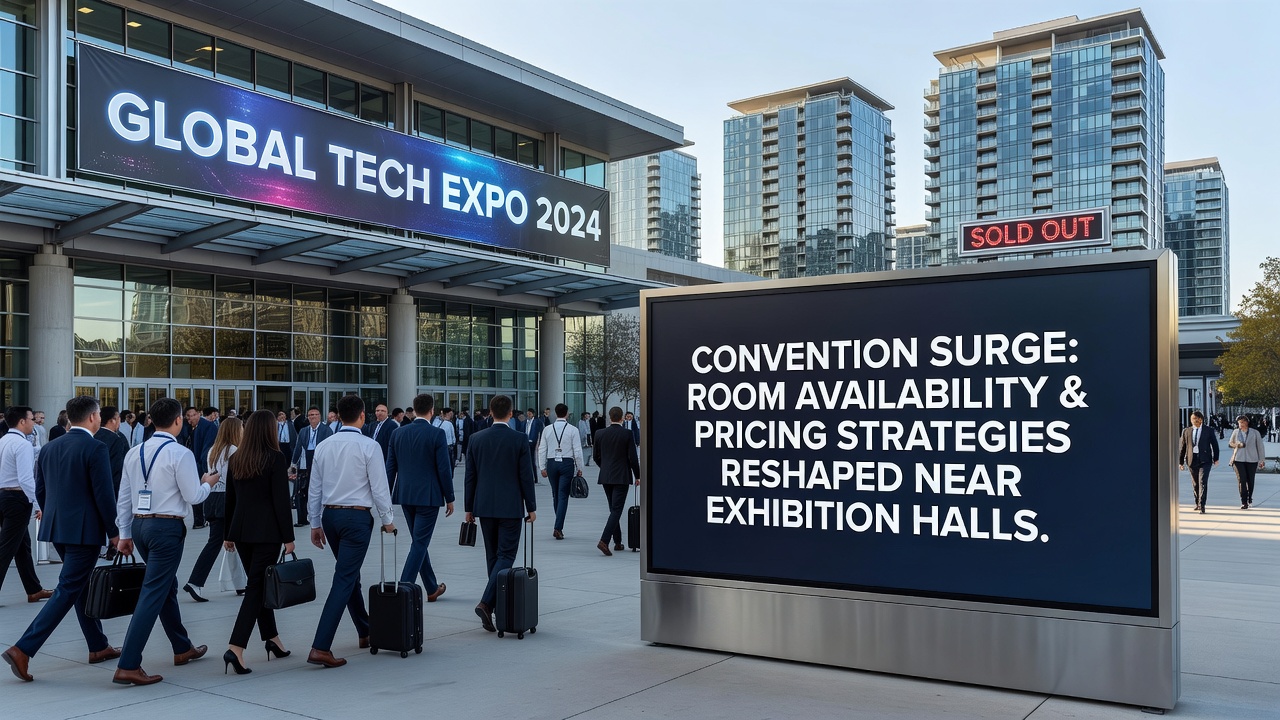
Convention activity has intensified across major cities, and hotel operators near exhibition halls now adjust room blocks and rates with increasing precision, according to data compiled by the International Association of Exhibitions and Events. Large gatherings compress inventory within walking distance of venues while pushing average daily rates upward during peak days. Observers note that properties located within a half-mile radius often reach 95 percent occupancy weeks before events open, leaving fewer options for transient travelers who arrive without prior reservations.
Inventory Compression During Peak Periods
Exhibition centers in cities such as Las Vegas, Chicago, and Orlando experience repeated surges when annual trade shows coincide with overlapping meetings. Hotels respond by releasing fewer rooms to public channels and reserving larger blocks for exhibitors and attendees who book through official housing bureaus. Research from Cornell University's Center for Hospitality Research shows that these blocks can account for 60 to 80 percent of available inventory at properties closest to the halls, which reduces last-minute availability and forces independent travelers to seek accommodations farther away or pay premiums for remaining units.
July 2026 already appears on several calendars as a high-demand window because multiple overlapping events are scheduled at the Las Vegas Convention Center and nearby facilities. Hotel revenue management teams have begun tightening allocations for that period, with some properties confirming that group contracts will consume nearly all standard king and double rooms on consecutive nights. Those who have tracked similar patterns in previous years recognize that walk-up rates can climb 40 percent or more once blocks approach capacity.
Dynamic Pricing Algorithms in Action
Pricing engines now incorporate real-time demand signals from convention registration platforms, flight data, and historical pickup curves. When registration numbers exceed forecasts, systems automatically raise rates in 15-minute increments during high-traffic booking windows. Industry reports indicate that this approach allows operators to capture revenue that would otherwise be lost to fixed-rate group contracts negotiated years earlier.
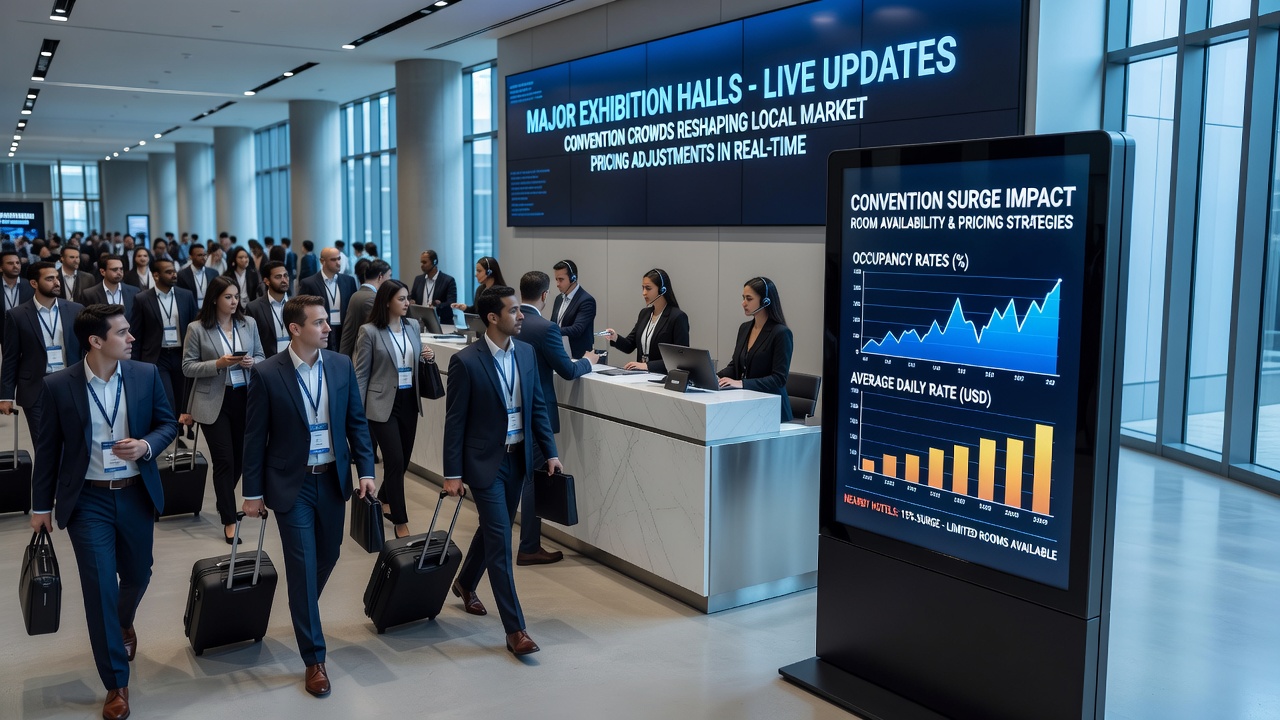
Yet the same algorithms sometimes release inventory back into the market when group attrition occurs, creating brief windows of availability at elevated prices. Travelers who monitor rates daily sometimes notice sudden drops followed by equally swift rebounds once another wave of bookings arrives. Data from a 2025 study conducted by Tourism Economics in partnership with the U.S. Travel Association revealed that properties within convention corridors adjust rates an average of 12 times per day during surge periods, compared with three adjustments at comparable hotels located outside the immediate radius.
Secondary Effects on Adjacent Neighborhoods
Surges also ripple outward. Hotels two or three miles from exhibition halls see increased demand once closer properties sell out, and some operators in those zones have begun implementing their own surge pricing to align with downtown patterns. Shuttle services and rideshare companies report corresponding spikes in requests that begin as early as 5 a.m. on peak arrival days. City transportation departments in several markets have added temporary bus routes to accommodate the overflow, though capacity on those lines remains limited during morning and evening rush periods.
Retail corridors near exhibition halls experience parallel pressure. Convenience stores and quick-service restaurants adjust hours and staffing to match attendee flows, while some boutique properties convert standard rooms into extended-stay suites for exhibitors who require additional square footage for product storage. These adaptations demonstrate how convention cycles influence not only lodging but the broader commercial ecosystem surrounding major venues.
Long-Term Planning and Forecasting Tools
Forward-looking operators now integrate convention calendars into multi-year revenue models. Software platforms pull dates directly from association schedules and cross-reference them with historical occupancy curves, allowing teams to project demand spikes up to 36 months ahead. This level of visibility supports decisions about staffing levels, renovation timing, and even menu pricing in on-site restaurants that expect heavier banquet demand during event weeks.
Those who have examined similar data sets across multiple markets observe that properties with flexible meeting space attached to guest towers gain an additional advantage because they can capture both lodging and function revenue from the same groups. In contrast, stand-alone hotels without integrated venues sometimes struggle to maintain consistent occupancy once the immediate convention radius reaches capacity.
Conclusion
Convention-driven demand continues to reshape lodging dynamics around exhibition halls through tighter inventory controls and responsive pricing systems. Cities that host frequent large-scale events have developed supporting infrastructure and data tools that help operators anticipate and manage these cycles. As registration numbers and travel patterns evolve, the strategies employed near major venues provide a clear window into how hospitality markets respond to concentrated, recurring surges in visitor volume.